How It Works

The
Science

What the device measures, how it decides, and why one number — temperature — is enough.

Start Here

A cacao bean out of the pod does not taste of chocolate. Fermentation is the stage that develops the flavour precursors. It takes about a week and occurs on the farm, before the beans reach a chocolate maker.

01

Beans go in the box

Wet beans and pulp go into a wooden box, covered. Nothing is added. The microbes already on the fruit do the work.

02

Microbes generate heat

Yeast and bacteria eat the sugars in the pulp. The reaction is exothermic: the pile climbs from ambient to as high as 50 °C. The heat is the reaction.

03

The pile must be turned

At one point the beans must be mixed to let oxygen in. Too early and flavour never develops. Too late and the batch goes acidic or mouldy.

04

Nobody can see inside

Experienced fermentors judge the stage by hand and smell, which takes years to learn. Without that experience the timing is estimated, and an incorrect estimate degrades the batch.

So: pile temperature is a direct readout of microbial activity. Log it every minute and the curve shows when the reaction peaks and turns over — the moment the beans need turning. GOcacao is a $100 probe that records that curve and signals the turn point. The sections below describe the hardware, the detection logic and the graded results.


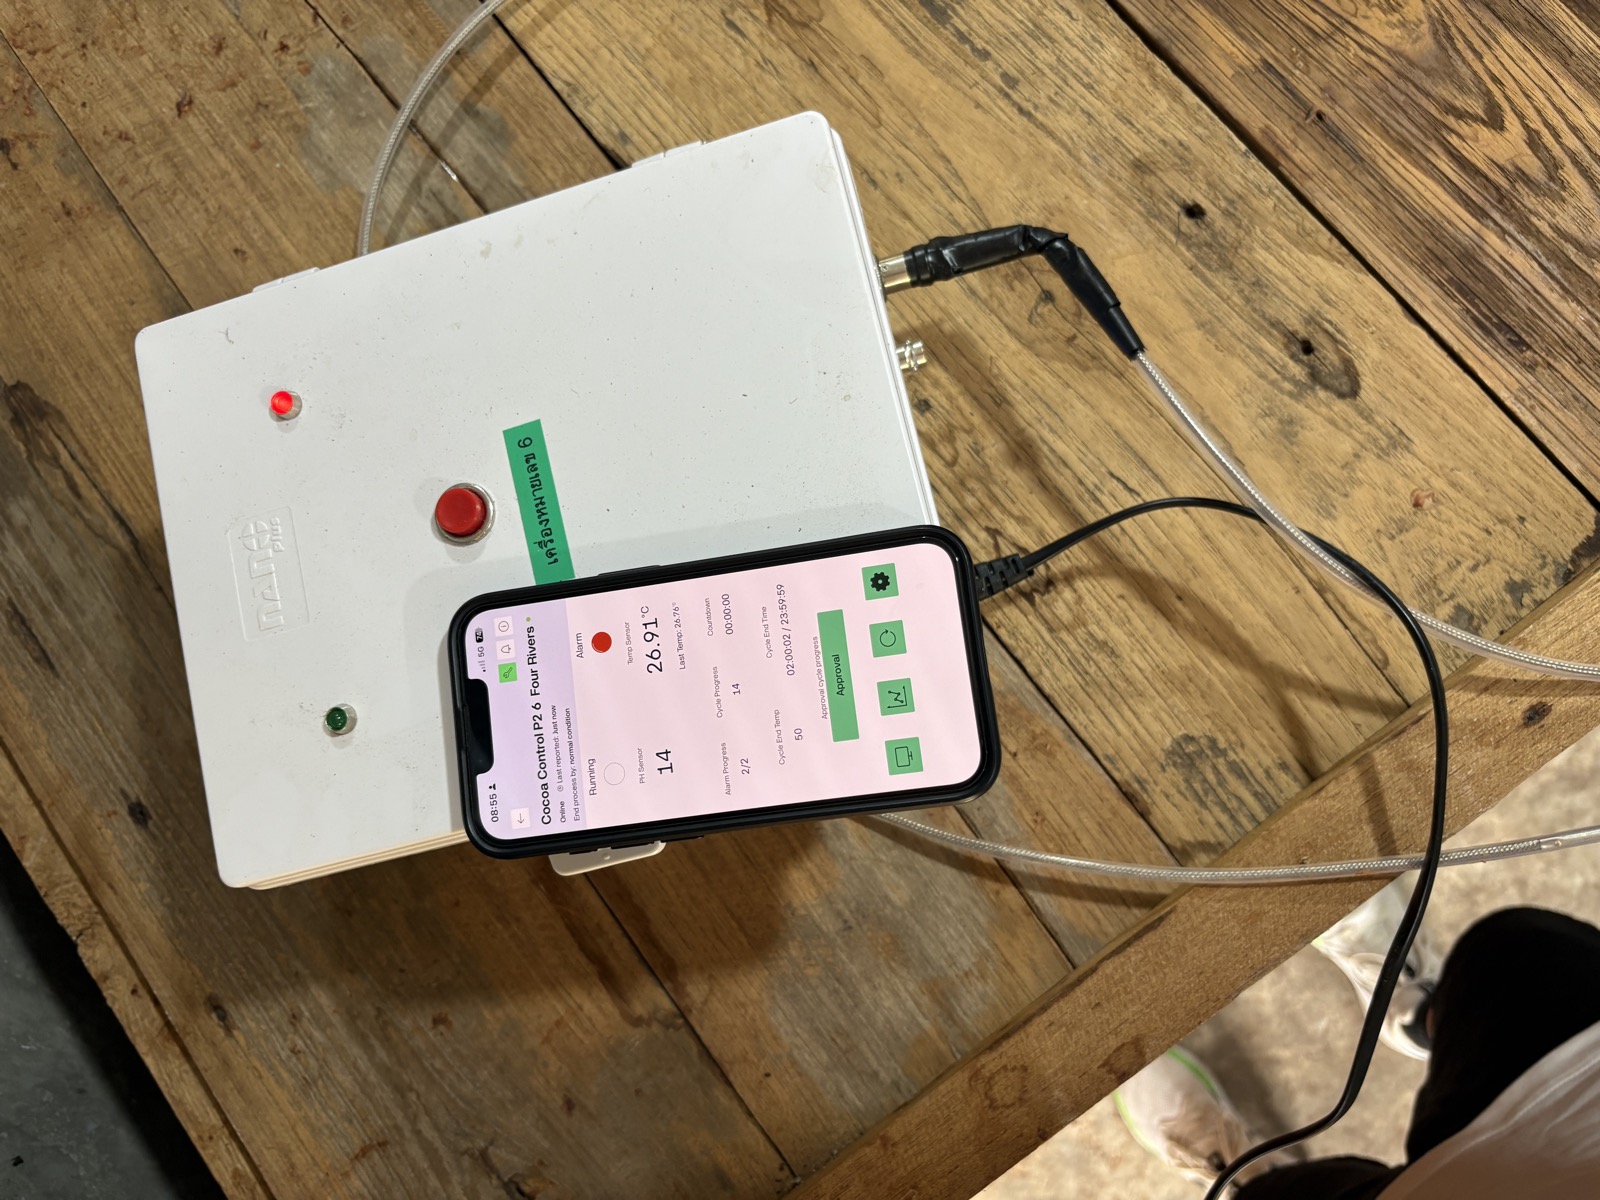
GOcacao device in a fermentation box
Device — Active Fermentation Monitoring
The Hardware

The hardware

$100, hand-sized. A food-grade stainless probe goes into the box and logs temperature every minute through the aerobic stage. It needs a wall plug; it does not need internet at the site. A version ships with connectivity included.

Every reading builds the curve in real time. When the curve signals the moment, the device alerts the farmer.

Probe material

Food-grade stainless steel

Log interval

Every 1 minute

Power

Mains — standard wall plug

Connectivity

No site internet required

Alert delivery

Real-time app + LED

Data export

Excel / CSV — full curve

The Logic

Detection logic

GOcacao runs a dynamic adaptive algorithm that uses temperature data to decide when to act. The pattern it looks for:

Temperature rises as microbes consume the pulp sugars. When it peaks, falls, and holds below that peak for a set number of hours, the aerobic phase is over. That is the turn window.

GOcacao detects the transition and sends the alert. The farmer sets the drop threshold per bean variety, climate and preference.

peak temp → sustained drop → turn alert
Customisable threshold — farmer-set · per-batch · per-region

1
Continuous Logging

Temperature is recorded every minute throughout the aerobic stage, building a continuous curve rather than a series of spot checks.

2
Peak Detection

The device tracks a rolling maximum. When the live reading falls below that peak and holds, it registers that the aerobic phase has turned over.

3
Sustained Drop Confirmation

It waits until temperature stays below the peak for the farmer's chosen number of hours. Every farm, variety and climate can have its own setting.

4
Turn Alert

The device fires an app notification and an onboard LED. The farmer turns the beans.


The Signal

The measured signal

GOcacao measures temperature and nothing else. Logged every minute, that single channel is enough: the curve shows when the microbes start, when they peak, and when to act.

Temperature 20 – 60 °C · every 1 minute

The aerobic fermentation stage is driven by microbial heat. As yeast and bacteria metabolise sugars, temperature rises. GOcacao logs this curve minute by minute — the shape of that curve is the data.

Turn Threshold Farmer-set · customisable per batch

The farmer sets how many hours below peak temperature trigger the turn alert. Fully adjustable per bean variety, region, and personal fermentation style. No two farms need the same setting.

Fermentation Passport Full curve · exportable

Every batch is a complete data record — minute by minute from start to finish. Export to Excel, generate a fermentation passport, and give buyers, researchers, and certifiers full traceability of every ferment.

Real Batch Data

Recorded batch curves

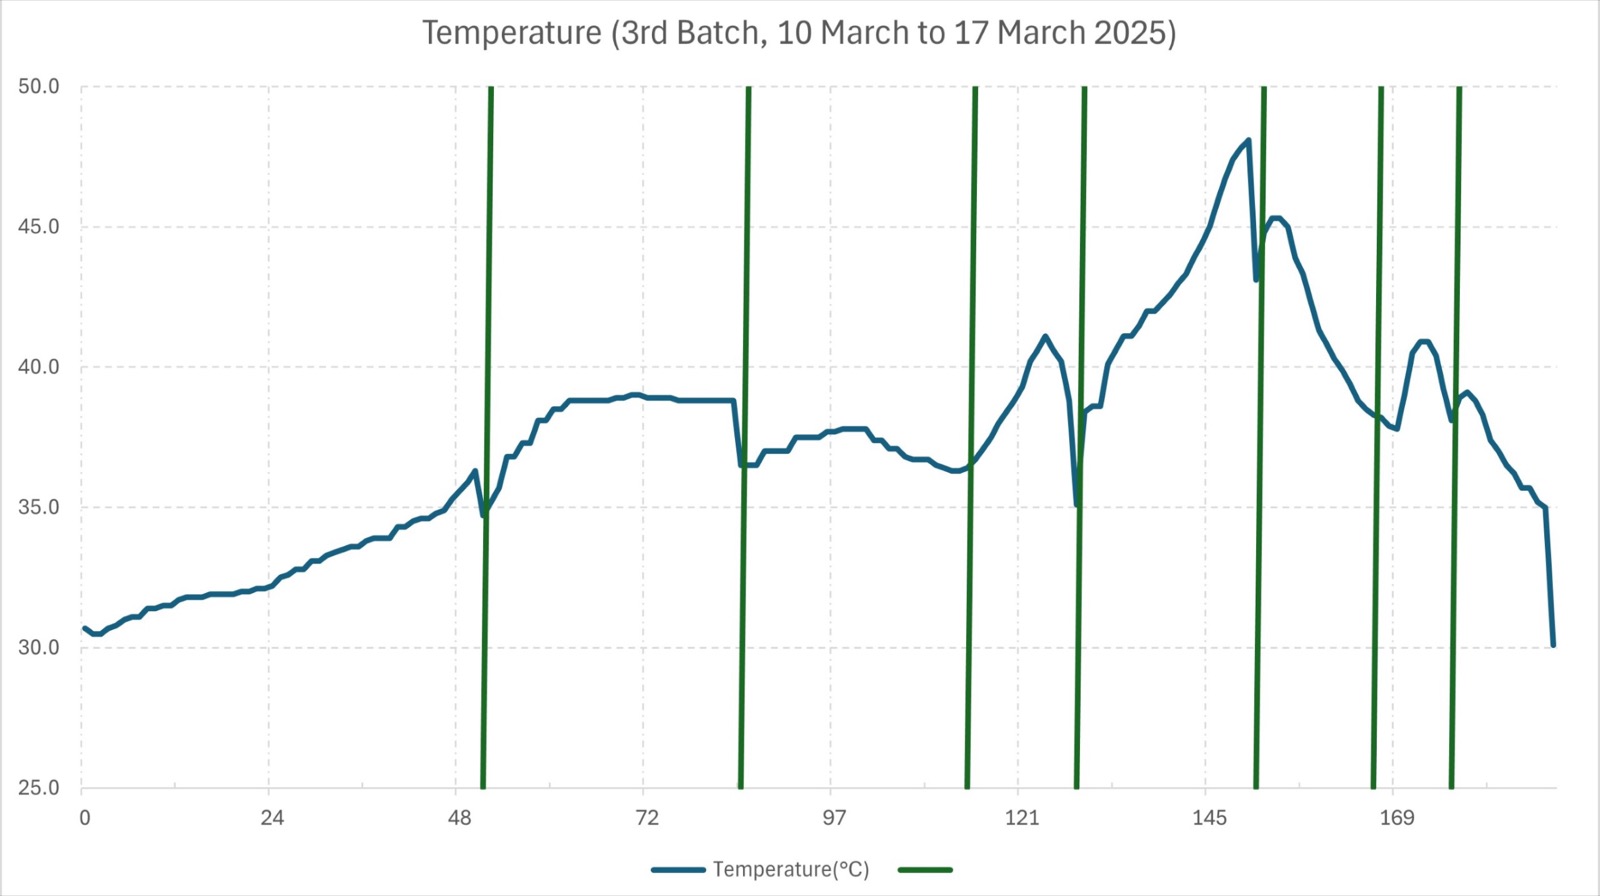
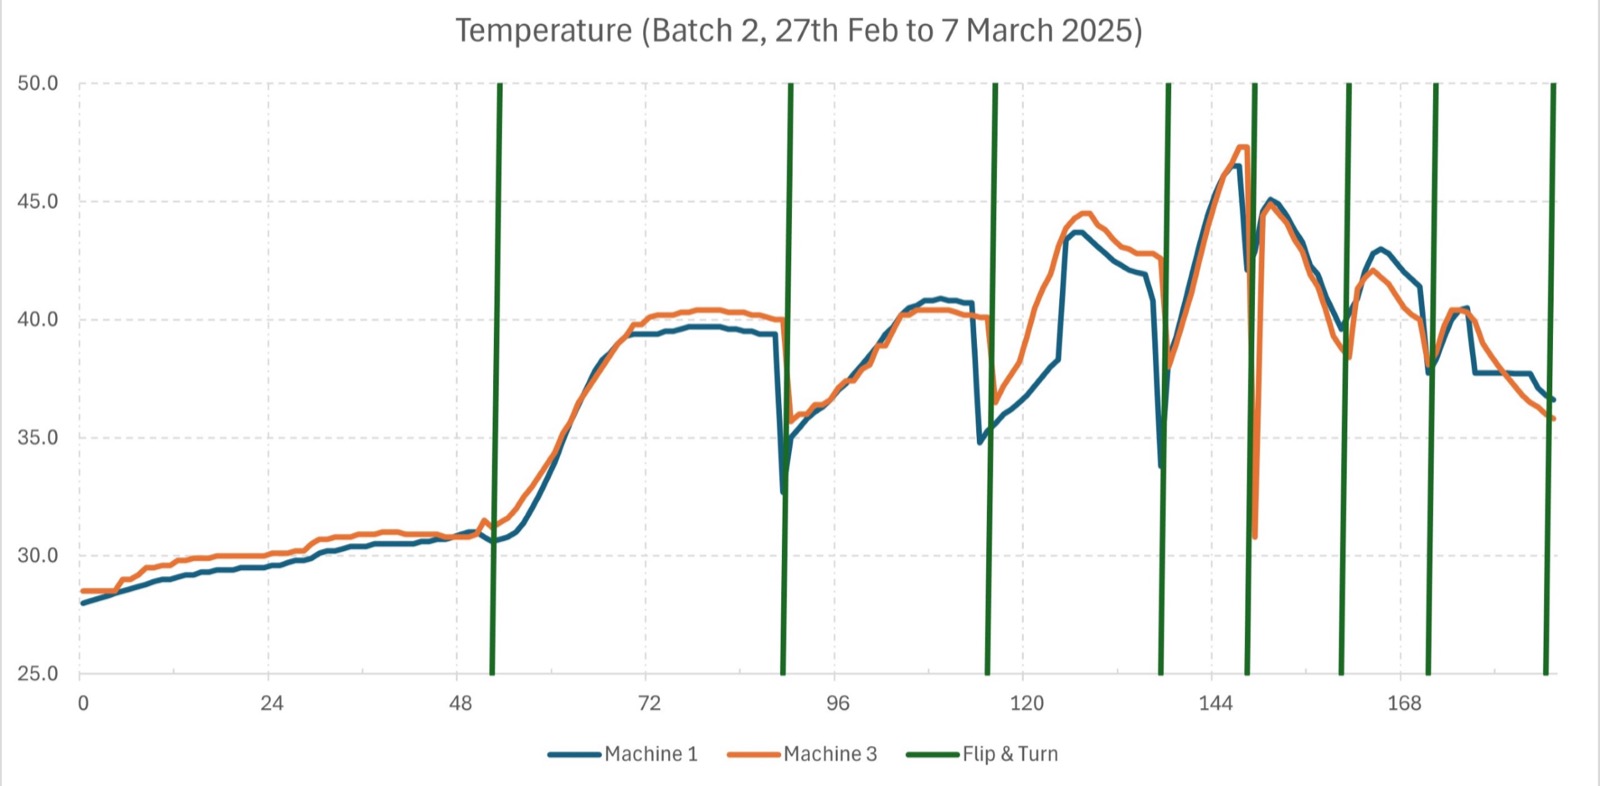
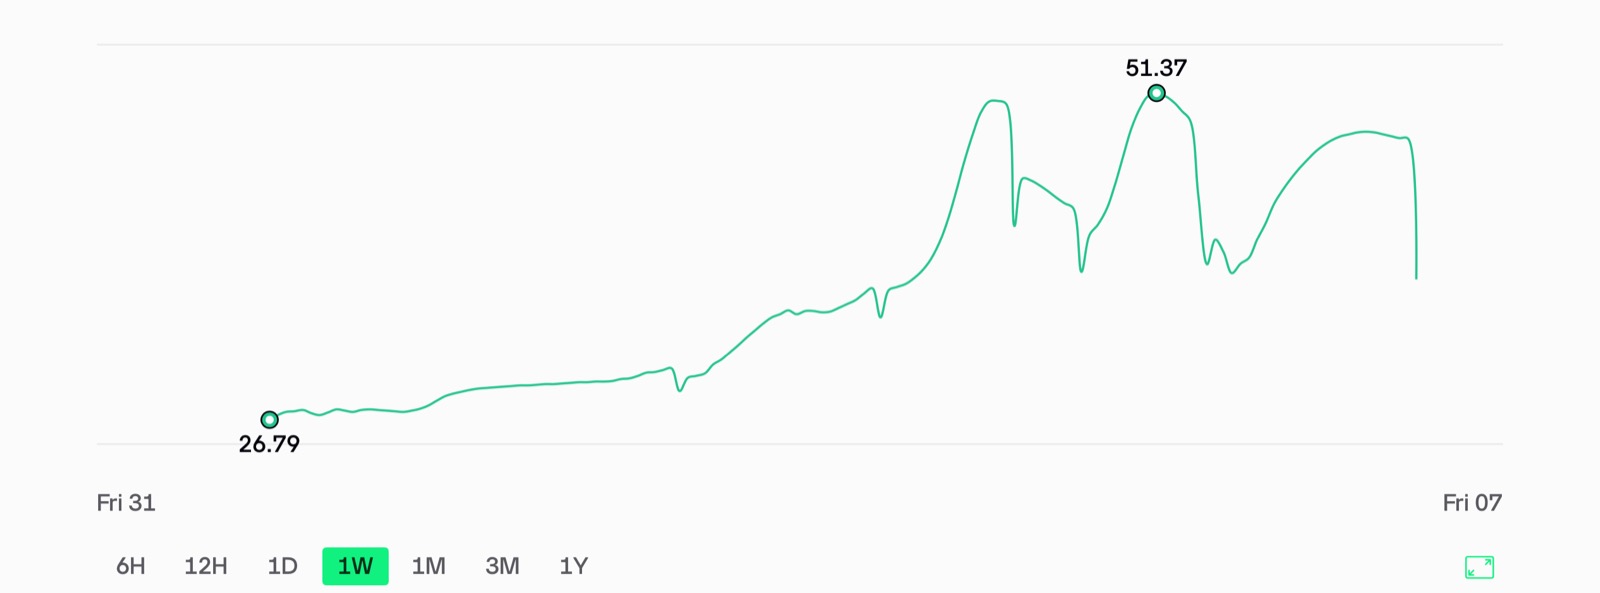
These are real temperature curves from GOcacao-monitored fermentation batches across Thai cooperatives. The rise, the peak, the turn signal — visible in every graph.

Fermentation temperature curve — batch 1
Batch curve — aerobic phase
Fermentation temperature curve — batch 2
Peak detection — turn signal
Fermentation temperature curve — batch 3
Completed fermentation — full curve
The App

The application

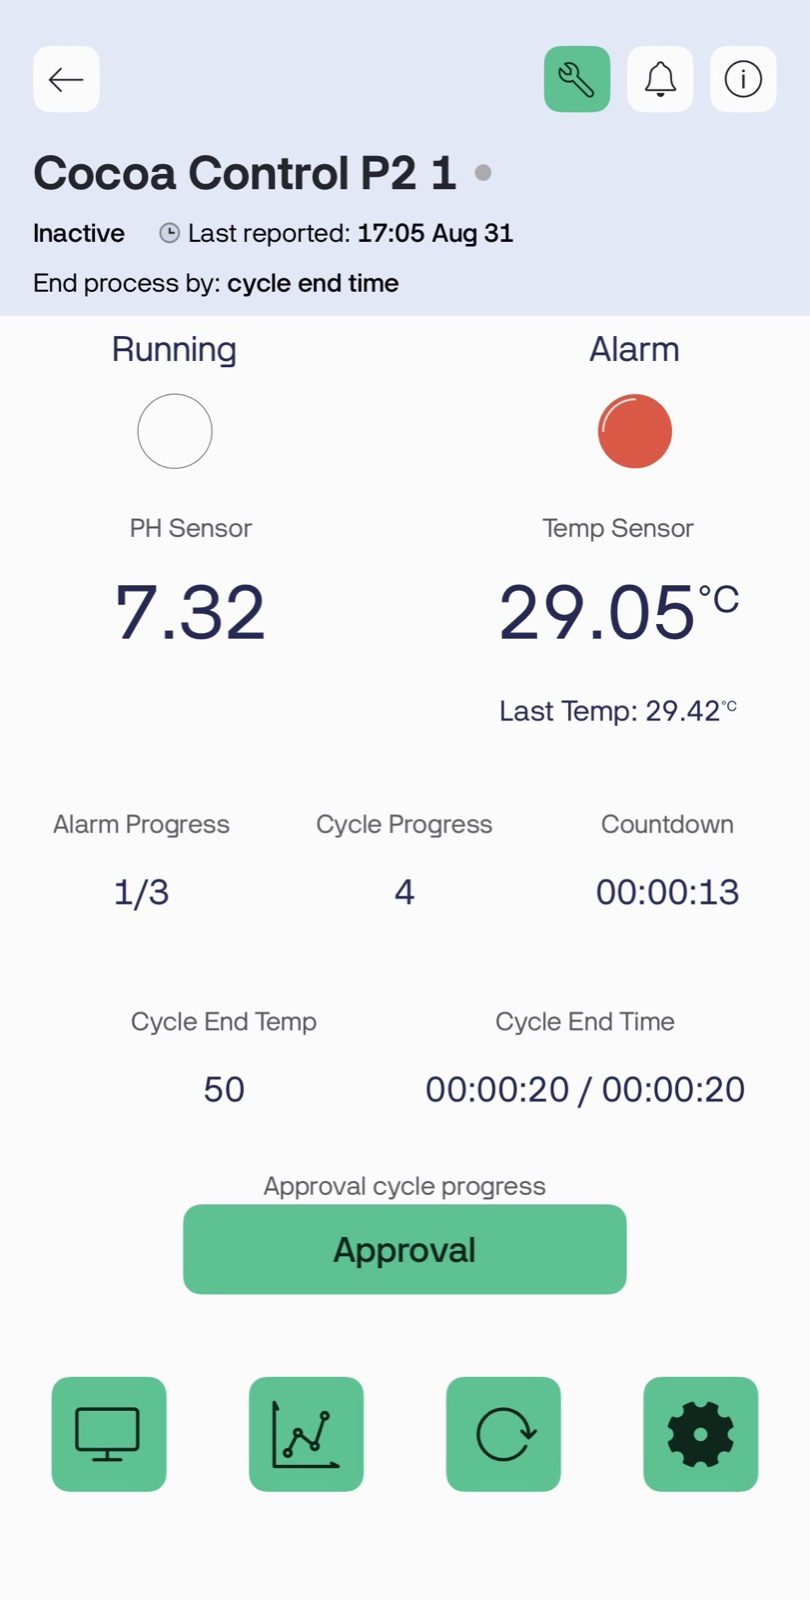
The GOcacao app displays the live temperature curve, the current rate of change, and alert status in real time. When the peak is detected, the alert fires instantly.

Every batch is stored — a permanent record of every minute of every ferment. Download to Excel, share with buyers, or build your fermentation passport library over time.

Available for

Connected version — we supply the connectivity, readings stream live
Standalone version — logs on the device, exports when you connect it

GOcacao app interface showing live fermentation data

What It Produced

Graded results

+20.3%

87.25 beans per 100 against a traditional mean of 72.5.

+23.2%

85 beans per 100 against 69 fermented traditionally.

−55.2%

Grade 4 fissuring CV, 22.67% down to 10.17%.

7%

Shorter ferment — the same result in less time.

4 monitored batches vs 4 traditional · cut and graded by a third-party professional cacao bean grading authority


The Farmer's Reality

Available alternatives

No purpose-built cacao fermentation monitor exists on the market. Farmers have three options: carry on traditionally, buy industrial equipment adapted from other sectors at $3,000–8,000, or use GOcacao.

Traditional Methods Industrial Equipment † GOcacao
Built for cacao Informal knowledge — no instrument No — adapted from other sectors Yes — purpose-built
Cost Labour only $3,000 – $8,000+ USD per unit ~$100 USD
Turning alert None — experience and guesswork None — manual data review Dynamic — farmer-set algorithm fires when the ferment is ready
Deployment Any location Fixed lab or site — not field-portable One device per box — fully decentralised
Scalability Scales with labour Very expensive to scale Unlimited — one device per box, no shared infrastructure
Setup required None Technician installation and calibration Plug it in — no technician, no calibration
Data capture None Proprietary — data locked to vendor Full export — CSV / Excel, farmer owns every point

† No purpose-built cacao fermentation monitoring equipment exists commercially. Industrial fermentation tools shown here are adapted from other agricultural sectors and designed for large centralised operations — not smallholder cacao cooperatives. The vast majority of farmers worldwide ferment entirely by traditional methods.

Chulalongkorn University Chulalongkorn
University — ISTC
Advisory

Academic advisory

GOcacao is advised by Asst. Prof. Dr. Tansiphorn Na Nan of Chulalongkorn University, who leads the university's cacao innovation work through the Innovation Center for Research and Development of Sustainable Thai Cacao (ISTC) at the School of Agricultural Resources.

ISTC works directly with cacao farming households across northern Thailand. That relationship keeps the device grounded in how fermentation behaves on a working farm, not in a lab.

ISTC at Chulalongkorn →
Photo Archive See all our photos → Field work  ·  Device  ·  Awards  ·  People
Gallery →
Independent Validation

Competitions and publications

Judged by international juries across three continents, with results cut and graded by a third-party professional cacao bean grading authority.

Read the Research